 Process
Analysis Toolkit (PAT) 3.5
Help Process
Analysis Toolkit (PAT) 3.5
Help |
PAT also provides an interesting interface to generate difference graph from
two graphs generated in the Simulator. This function is developed
to provide means for comparing the differences between similar processes. For
instance, you can use this tool to generate a difference graph with your system
and the abstracted model of your system, or with the implementation and
specification of your system. The Graph Difference Analysis tool has several choices for different purposes
of users. Configure the tool before starting using: From the tool bar: Match Type: Complete or Partial match. Match Result Display: Integrated or Separate (See the
figures in the last row). Graph Match Settings: Match State Structure, Match Process
Parameters, Match Event Details, Match if/guard Condition Expression; these four
can be multiple choices; Generate Difference Graph: press this button to generate the
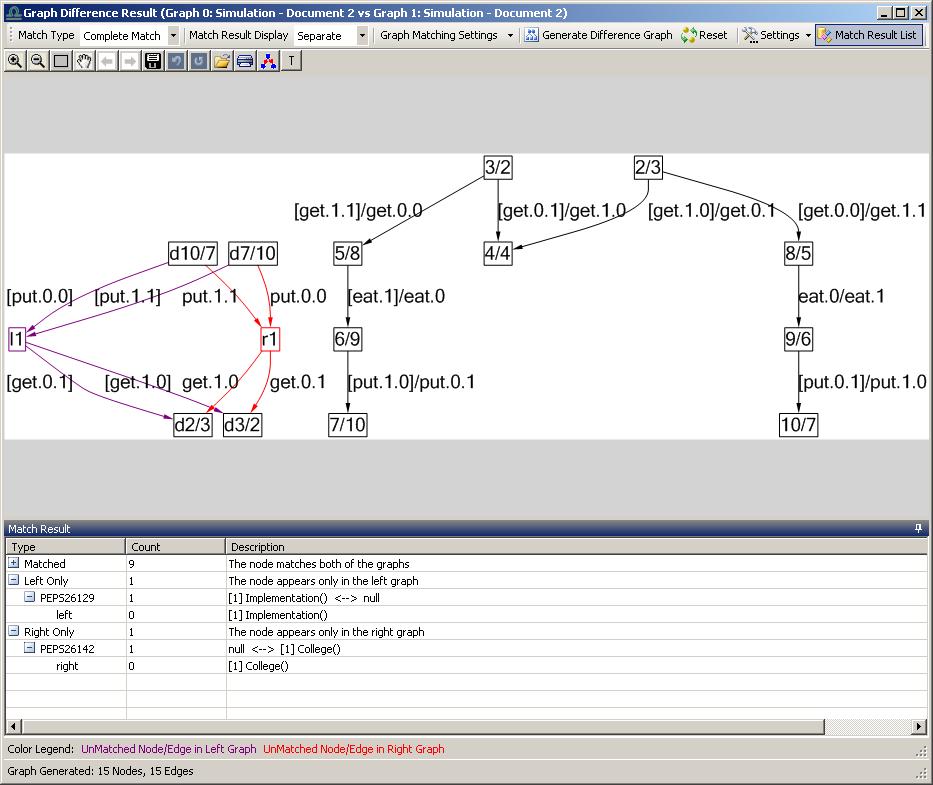
difference graph for previously chosen graphs. Match Result List: this button provides a list of matching
results including matched edges/nodes and unmatched edges/nodes in the left
graph and the right graph. Take the classic problem Dining Philosopher as an example, we generate the
difference graph from the system graph and the implementation graph. First, generate the desired processes in Simulator
separately and then choose the corresponding graphs to be compared, such as the
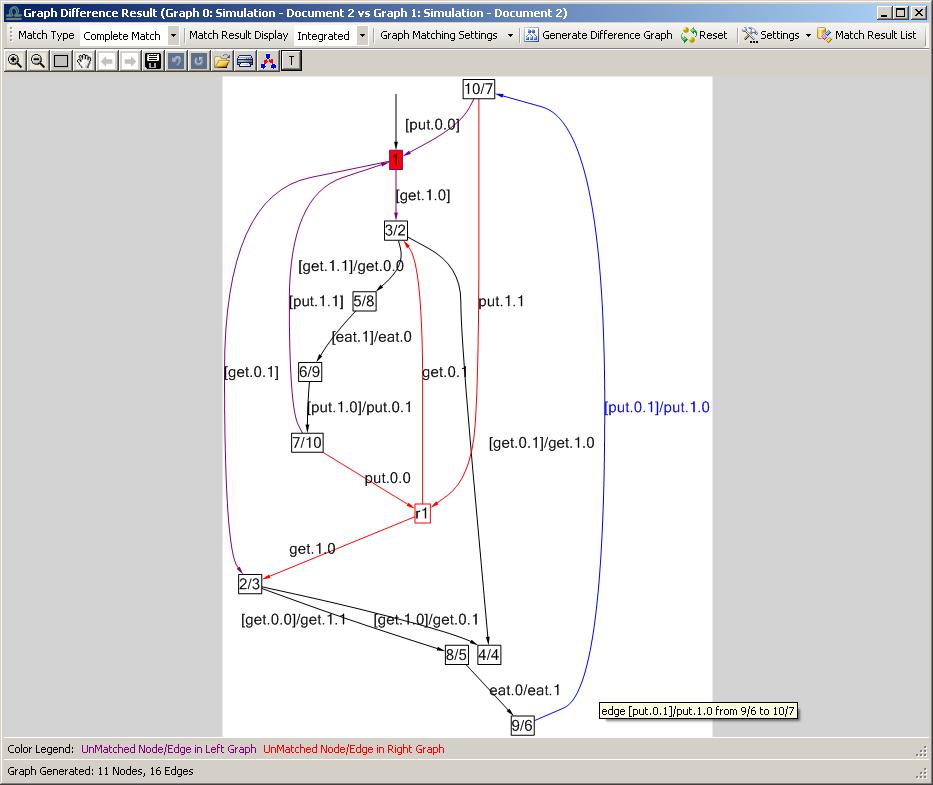
figure below: Secondly, generate
the difference graph in the Integrated(left) manner and the Separate(right)
manner respectively.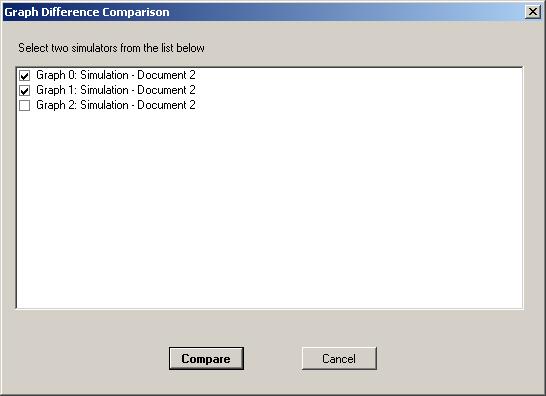
Copyright © 2007-2012 Semantic Engineering Pte. Ltd.